Media Bias Chart – Understanding Political Bias and News Source Reliability
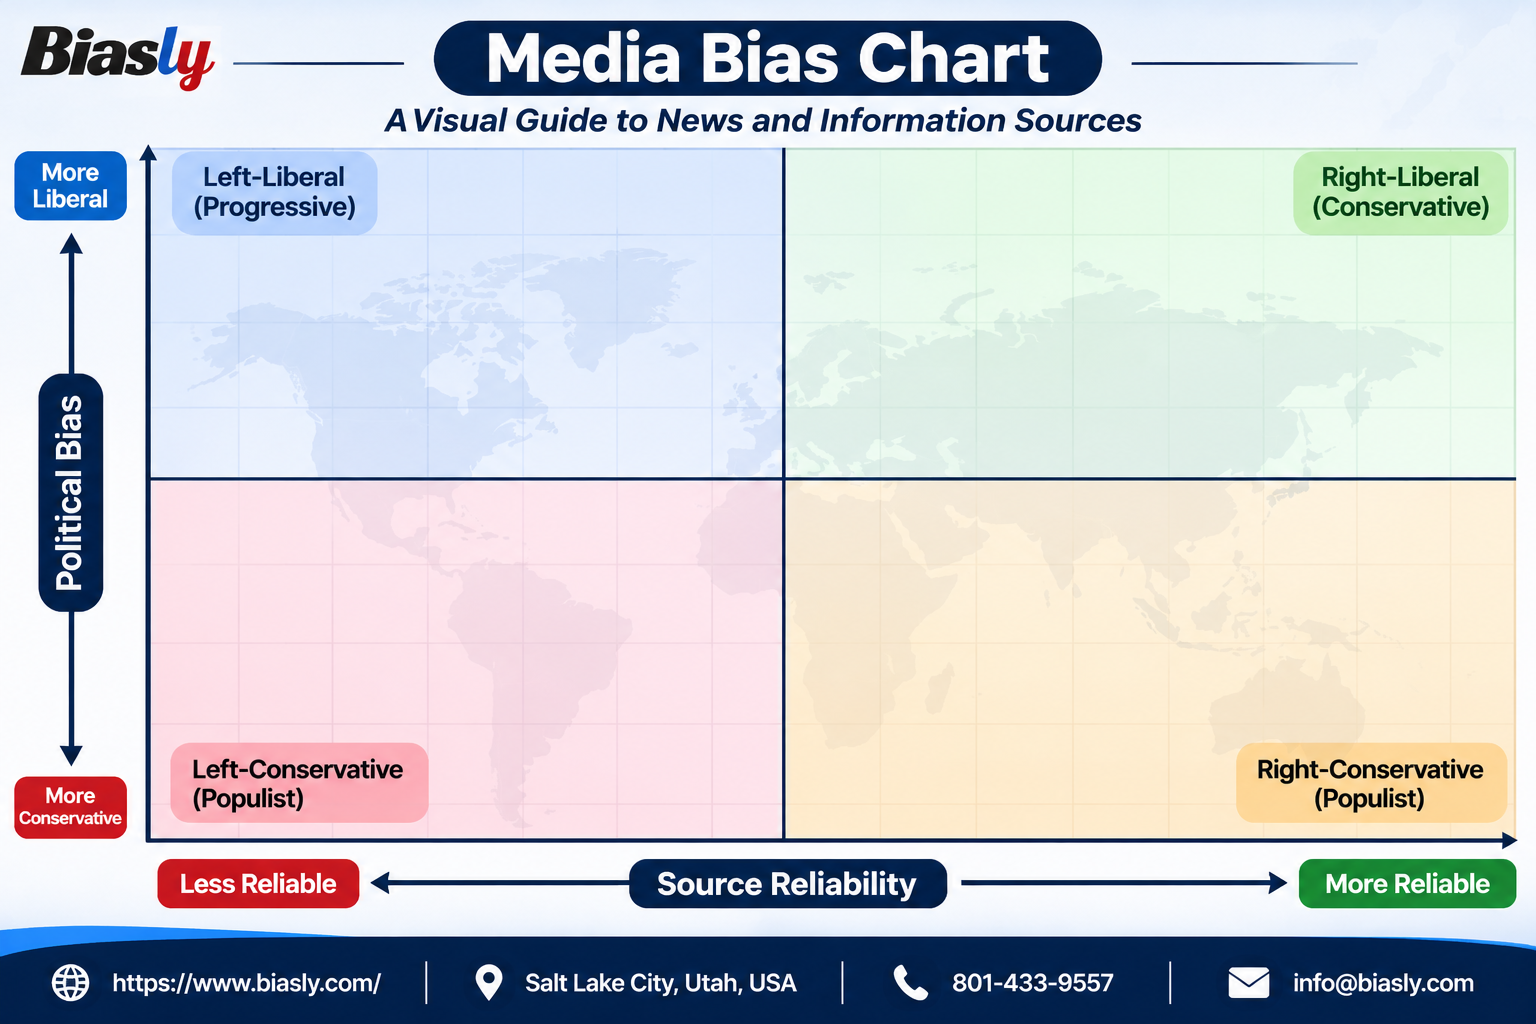
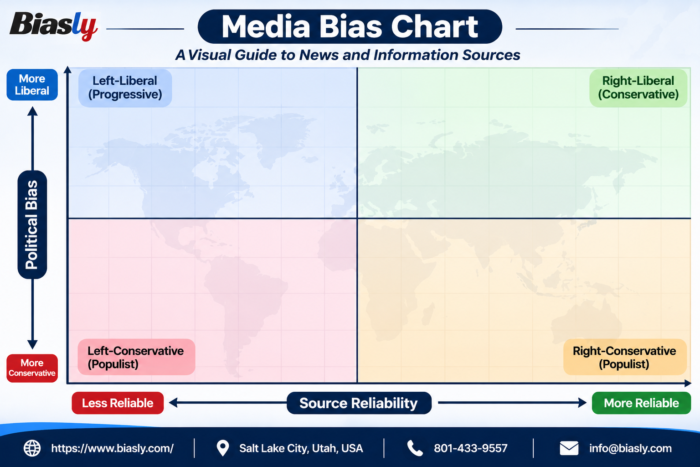
The Media Bias Chart provides a visual representation of political bias and news source reliability across different media perspectives. It categorizes sources into four quadrants based on their political orientation, from left to right, and their level of reliability, from less reliable to more reliable.
Created for a more informed media landscape, this chart helps readers understand different perspectives, evaluate news sources, and make informed decisions. Biasly promotes balanced media analysis and greater awareness of media bias.